Showing posts with label Homework. Show all posts

Saturday, April 26, 2014

Carbon Offsets

Carbon offsets; a scam or something good? I had never heard of carbon offsets before and was surprised to learn that carbon offsets work like this...You pay money, as an individual or business, based on your carbon output. So you can calculated based on your car, how you heat and power your house, how often you fly and/or take the bus, to determine your carbon output. Then you pay the amount the calculator determines, and that goes to funding projects such as renewable energy or reforestation, therefore “offsetting” the carbon output you give off living your daily life.
A renewable energy certificate or REC is a representation of the property rights of the nonpower qualities (environmental, social, etc) of generating renewable energy. REC’s allow buyers to support renewable energy even when there may not be any renewable sources local to them. The figure below shows how the work by detailing how physical electricity and REC’s work separately and together in a renewable generator.

REC_chart.jpg
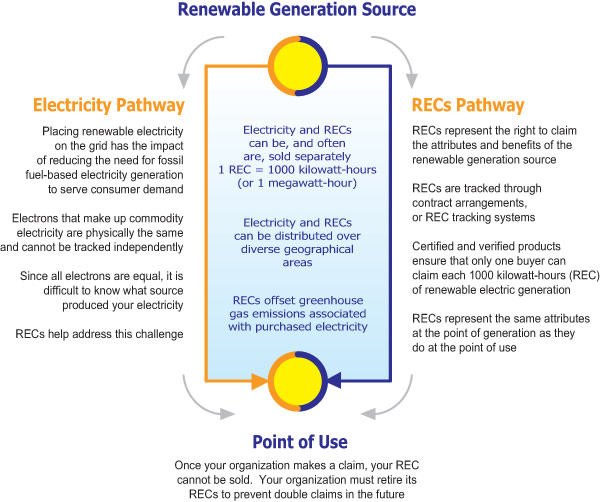
Figure 1: Renewable Energy Certificate Use
This image shows how a REC works. It shows the two components of a renewable generator source: physical energy and REC’s and how they work together.

At http://www.carbonfund.org/ I plugged in my information to find out what my carbon offset would be. They had me input how many people lived in my house, what kind of heating we use, what make and model my car was and how many miles a year I drive it. Since I do not own a house, but live at home (when I’m not at school) I put in that there are 6 people in my house, instead of just me, because all six of us live and use the heat and electricity, etc. I added my car, but because I do not drive a lot at school that number was fairly low, compared to what it might be if I had to commute to work or school everyday. My total was $333.52. Again, that number might be different if I could calculate for just myself and not my entire family. It would also be different if I took into account my lifestyle at school. If I wanted to simply offset 1 ton, it would cost me only $10.

At http://www.nativeenergy.com/ I plugged in information differently. They simply wanted to know the number of houses and specific sized cars (small, midsized, large). So I said one house and one midsized car. My output according to this site was 18 tons of carbon, or $252 to offset. This was less, but they did not need specifications for how big the house is or how we heat it. They also narrowed down car by approximate size, but not make or model. On this site, simply offsetting 1 ton would cost me $14 dollars.

If I had to pick one of these to complete my offset, financially I would lean towards Native Energy, because plugging in 1 house, 1 car was cheaper for me. But the Carbon Fund allowed me to be more specific and while it was using averages and did not take into account that maybe I never turn on my lights or only run heat for 2 months rather than maybe always having a light on, or running my heat from October to April, I was able to get a more realistic view of my carbon footprint. The Carbon Fund has far more partners than Native Energy, and is a non-profit organization, but Native Energy had some more recognizable clients including companies that work in food, music, and apparel such as LiveNation, Clif Bars, and Under Armor. Each included insurance agencies and environmental agencies, which I am not as familiar with making it difficult to judge who has more reputable partners. I am curious to know why Native Energy would charge $4 each ton to offset. That doesn’t seem like much when dealing with 1 or 2 tons but make it thousands of tons and the difference is much more noticeable.

This strategy of taking money based on your carbon output, in tons, and turning it towards making clean energy or reforestation sounds well and good, but it could lead to more issues. I think that people who are struggling right now to pay for heat that they need (especially during the Polar Vortex this past winter!) would fall into debt and could end up fighting this. It seems as simple as, use less heat or drive less, but people still need to find a way to heat their homes and get to work (not everyone has public transportation around them). I think that this sounds great, but until there are other options, which this is working towards supposedly, that people can turn to instead of fossil fuels. I think that if there were readily avaiable and affordable options for people to switch too, this kind of offset or tax could be a great motivator. It just has to be done in the right way at the right time, and who gets to decide what way that is and when? Those are the tough questions.


Bibliography
http://www.epa.gov/greenpower/gpmarket/rec.htm

Monday, March 24, 2014

What Led the Vikings to Leave Greenland?

During the Medieval Warming Period around 1000 CE the vikings in Greenland prospered. Because they were more farmers than fisherman, their agriculture flourished. With the melting of the ice on and around the island, the Northwest Passage opened for travel and trade with European countries. As the temperatures dropped falling into what is known as the Little Ice Age, a drop of about 1.1 degree Fahrenheit by around 1700 CE, many things happened. This climate change meant a change in the amount and placement of ice, changing their boating routes. Around the same time, the demands for their exported goods was lowered and the more difficult boating routes along with less income made it more difficult to attain the necessary imported supplies. Colder temperatures also brought freezing ground, and difficulty farming; although evidence suggests they were able to adapt to fishing fairly easily. Therefore because the drop in temperature brought changes to the climate and altered their land and boating routes, the vikings also had to adapt and leave Greenland.


Figure 1: Temperature from 1AD to 2000AD

This figure shows the temperature from the year 1AD to 2000AD. As you can see there is a gradual drop from around the year 1000 to around 1700. This is the drop from the Medieval Warming Period into the Little Ice Age, about .6 degrees Celsius or about 1.1 degrees Fahrenheit. This is the period in which the Vikings in Greenland experienced changes and decided to leave.


Sunday, March 23, 2014

Marcott et al (2013)

A study by Marcott et al that reconstructed the Earth’s climate over the past 11,300 years using data gathered by various proxies at 73 locations globally. The findings of this study showed that the Earth had been gradually cooling over the past 5,000 years up until about 100 years ago, when it began to warm. The Holocene era, the studied time period, experienced gradual climate changes which allowed for the flora and fauna to adjust. The more recent changes though, are more rapid and may exceed the hottest period during the Holocene period. The recent warming is due to human activity, not natural causes. This is evident especially when examining the fact that because of the Earth’s orientation, the Norther Hemisphere should be experiencing cool summers as part of a cooling trend, which is not occurring. It is projected that the temperature will increased anywhere from 2 degrees to 11.5 degrees Fahrenheit by the end of this century.  
Three key findings of the study include the fact that the 1.3 degree cooling that occurred over the last 5,000 years was reversed in just the past 100 years, and the temperature will continue to rapidly increase. Another key finding is that with the natural changes of the Earth the Northern Hemisphere was projected to experience intense cooling over the next few thousand years but most likely will not because of the increase output levels of carbon dioxide and continued warming. A third finding is that this past century is an anomaly because we have not experienced this level of warming since the most recent ice age over 11,000 years ago.

marcott-et-al-2013-2.jpg

Figure 1: Temperature Anomaly for previous 2,000 and 11,000 years.
These two graphs temperature data for the Earth over the Holocene period. The figure on the left shows the same data as the figure on the right, zoomed in to 2,000 years. These graphs illustrate the warming and gradual cooling experienced during the Holocene period with the rapid jump in temperature over the past 100 years. As illustrated in the graph on the right, the current temperature is very close to the warmest time of the Holocene period.


According the Michael Mann of Pennsylvania State University, the main conclusion of this study by Marcott et al is “the rate of warming appears to be unprecedented as far back as the authors are able to go (to the boundary with the last ice age). And the rate of warming appears to have no analog in the past”. The warming that we are experiencing, and the rate at which it is occurring is not by means of nature as it has been in the past. With increased human activity and output of carbon dioxide among other greenhouse gases into the environment, the Earth is going through rapid changes that we have not seen before.
Concerns that Robert Rohde, the chief data analyst behind the Berkeley Earth Surface Temperature project, has are that in the study they relied too heavily on their proxy data which was spread out in time. This can blur or obscure the fluctuations in the data. Because of this he thinks that, “we can’t use the analysis of Marcott et al. to draw any firm conclusions about how unique the rapid changes of the twentieth century are compared to the previous 10,000 years.” Ultimately he recognizes the impact that the findings have in building upon current knowledge as well as assisting in future studies, but he urges the use of caution when comparing their findings and current events.
According to Richard Alley, of Pennsylvania State University, the big-picture messages from this study are, for one, “Our high assessed confidence that the recent warming is mostly human-driven, and that the costs will become large if the warming becomes large, do not primarily rest on how much warmer or colder today is than some particular time in the past, or even on how fast the recent changes are relative to those in the past.” Meaning scientists aren’t conducting these studies and saying that because today is hotter than it was 1,000 years ago means that we’re experiencing global warming; they look at the many factors that go into what climate is and what the climate is and has been around the world. Another takeaway is, “Whether the past was naturally warmer or cooler than recently, and whether the changes were faster or slower than recently, are of great interest to climate scientists in learning how the climate system works, including the strength of feedbacks.” So while we cannot look at 1 day or 1 year for comparison, it is still extremely important and valuable that scientists continue to study the past in attempts to understand how climate works that that we may appropriately prepare for the future.
Roger Pielke, professor at the University of Colorado, addresses in a blog post that the media made some mistakes when covering this study. There has been various coverage of the study that explains the resulting temperature data as fitting into the “hockey stick” analogy. The coverage explains that there has been a sharp increase in temperature in the past 100 years, the blade of the stick. Pielke explains this is wrong. He explains that the 20th century data is “not statistically robust” therefore there can be no “blade” for Marcott et al’s study.    

Wednesday, March 19, 2014

What Caused the Ice Ages?

There are many factors that together can be used to try and explain what caused the ice ages the Earth has experienced. In order for an event to occur many things need to happen. There need to be certain boundary conditions, a trigger (which without those specific conditions would be irrelevant), feedbacks and a tipping point. 
To explain the ice ages we have to set our boundary conditions: the Earth rotating on it’s axis. This is how the Earth is and how it rotates around the Sun, plain and simple. The trigger would then be the Sun’s output of radiation as well as the Earth’s position on the axis as well as in relation to the Sun. These things alone do not cause an ice age, but when factored all together the Earth experiences a feedback. The Earth may be farther away from the Sun at a point and temperature drops because of the lessened amount of radiation reaching the surface. The temperature drops, which causes ice to form. The more ice that forms, the more radiation is reflected from the surface, which causes the temperature to drop even more. The tipping point is the resulting glaciers and ice sheets that cover large masses of land. 


Figure 1: Earth's Axis and Rotation
Image Source: www.eoearth.org
In order to help illustrate the effects that the Earth's position in relation to the Sun has, here is a figure to illustrate how the Earth's axis changes. You can see how the position of the Earth on it's axis has changed as well as it's relative position to the Sun.

Scientific Poster Presentation Checklist

"Assess Your Poster." Assess Your Poster. N.p., n.d. Web. 19 Mar. 2014. <http://www.tc.umn.edu/~schne006/tutorials/poster_design/assess_01.htm>

Here is a checklist that was created to help you evaluate your poster. It is set up in the form of questions, asking if your poster visually appealing, delivers the message efficiently, and will attract people to want to see it. By going through the 18 points you should be able to see if your poster is lacking in any area, or if it has too much and needs to be toned down. By asking questions it's forcing you to take on a different perspective and evaluate your poster as if it were someone else's poster that you were looking at.

Scientific Poster Rules

Erren, Thomas C., and Philip E. Bourne. "Rule 1: Define the Purpose." National Center for
Biotechnology Information. U.S. National Library of Medicine, 25 May 2007. Web. 19 Mar. 2014 <http://www.ncbi.nlm.nih.gov/pmc/articles/PMC1876493/>.

NCBI put together a list of "Ten Simple Rules for a Good Poster Presentation". Accompanied with each rule is a short paragraph to expand and further explain what the rule means and/or why it is important. The rules cover the look and format of your poster as well as your presentation of the poster. A quick read, the rules give you tips and advice for how to create and give an A+ poster presentation.

To read the Ten Simple Rules click here!

Saturday, March 8, 2014

Tipping Points

Tipping points sorted by their likelihood of occurring within the next few decades.


Very Likely:
Increased production and emission of carbon dioxide will continue to be a major cause in the increase of the Earth’s temperature and climate changes. If we don’t start cutting emissions now, the effects could become more devastating.
Somewhat Likely:
Having ice-free Arctic summers could start a waterfall effect as higher temperatures could melt permafrost, releasing carbon dioxide and causing further warming and melting.
Not Very Likely:
The runaway greenhouse effect.
One version of the feedback is described as water vapor accumulating in the atmosphere as it warms. The warmer the atmosphere, the more water vapor. The more water vapor that accumulates, the more heat gets trapped, and the temperature continues to rise. This feedback would continue uncontrollably until the oceans have evaporated.
Another version would be that as snow and ice accumulate over the Earth, more and more sunlight is being reflected back into space. This causes a cooling, resulting in more snow and ice, until the entire Earth is covered and becomes frozen.

To read more check out these articles:

Tuesday, March 4, 2014

Ice Albedo Feedback

The ice-albedo-feedback is quite simple, but very serious. Snow and ice reflect the sun which means that they do not absorb much of the solar radiation, they have a high albedo. The water around the snow and ice is much darker, absorbing more of the Sun's radiation (a low albedo), causing the water to heat up. This heating then melts the snow and ice, exposing more of the water, absorbing more of the sun and heating more, and so on. The more water is exposed, the more heat it absorbs. The more heat it absorbs, the more the ice melts exposing more water.


Figure 1: Ice Sheet Albedo
Image Source: http://hot-topic.co.nz/wp-content/uploads/2012/07/GISalbedo201207.png

You can see in this figure how the albedo, ability to reflect sunlight, decreases into the summer months of the Northern Hemisphere (May - August) and then increases into the fall and winter months. This illustrates how as the temperature increases and ice melts, more radiation and heat is absorbed, melting the ice, and so on. 

Ice Cores

Because ice cores clearly show different layers of ice, dust, volcanic ash, etc, years and seasons are clearly distinguishable. This means that scientists can zero in on different years fairly easily and analyze what was happening during that time. Ice cores reveal atmospheric circulation patterns, because they show dust, volcanic ash, salts, etc. This means that scientists can analyze what they find in the ice cores in order to see what was happening but also why. They are able to determine wind strengths and pressure centers from the concentration of dust, ash, salt, etc. Ice cores also hold information about carbon dioxide concentrations. From the concentration of carbon dioxide in a particular part of the ice core, scientists can determine if that part of the Earth was experiencing a glacial or interglacial period because lower concentrations correlate with colder temperatures and visa versa.


Figure 1: Ice Core Data
Image Source: http://joannenova.com.au/globalwarming/graphs/ice-cores/vostok-ice-core-petit-web.gif

This figure shows the relationship between carbon dioxide concentrations found in ice cores in Antarctica as well as the temperatures. Seeing this correlation, scientists can now further relate lower concentrations with colder temperatures and high concentrations of carbon dioxide with high temperatures. 

Ocean Sediments Profile

Here I have created a mock dating profile for Ocean Sediments. In includes a little bit about ocean sediments as well as it's strengths, weaknesses, "goal" as well as two figures.

Monday, March 3, 2014

The Quaternary Period

The Quaternary Period is a period of time that covers the last (approximate) 2 millions years of the Earth. This period is often called the “Age of Humans” although it did see many periods of cooling. At the start of the Quaternary Period the continents had reached just about to where they are now, but further moved to where they are currently. This period experienced ups and downs in regards to “ice ages” or glacial periods and interglacial periods. By around 800,00 years ago a cycle of glacial periods lasting around 100,00 years split with 10,000-15,000 year interglacial years began. Shifting in plates as well as drops in temperature caused sea levels to drop and land bridges to be formed. This allowed the migration of animals and people as well as changed global winds and ocean currents. When temperature rose, so did sea level and everything changed again. This up and down pattern was set up by the cooling trend that the Cenozoic Period saw millions of years before. One theory of Milutin Milankovitch, was that the Earth’s position in relation to the Sun had certain astronomical implications. Further, he theorized that the up and down nature of the changing climate was due to positive and negative feedback systems in the climate system. There are also a theory of Dr. G. C. Simpson’s that says that along with the shifting of the plates, the Earth’s position in relation to the Sun changed ever so slightly, causing an increase in solar radiation. This would then lead to an increase in evaporation and therefore an increase in clouds and precipitation. Recently the climate has been changing more rapidly, as you can see on the figure below where the high’s and lows become more dramatic. With an increase in in carbon emissions due to human activity starting around 190,000 years ago, scientists now believe that humans are playing a huge part in the increase in temperature of the Earth as well as climate change.


quaternary_graph.png

Figure 1. Quaternary Period
Image Source: qru.org.uk
This figure shows the up and down nature of the climate for the past 2.6 million years.

Thursday, February 27, 2014

Dendroclimatology

Dendroclimatology is the process of using tree rings to determine the past climate of the Earth. Scientists look at width to determine if the climate then fostered favorable conditions for growth. Scientists also looked at density, which can give better data than ring width. Tree rings have many advantages as climate proxies. Because tree’s have rings that are consistent markers of time, it is fairly easy to get precise dates. Furthermore, because tree rings respond to more than just temperature, they can be used to determine other aspects of past climate as well. Scientists collect tree rings, often using a handheld device, before bringing it into a lab to study and test. Scientists are able to determine things such as droughts, volcanic eruptions, and of course temperature.
To read more check out the wikipedia page here or this interesting case study!

What is Paleoclimatology?

Paleoclimatology is the study of the Earth’s past climates. While we have temperature records for several decades into the past, the Earth has been around and thriving for millions of years. Before we had thermometers and other measures to collect data about our climate, there was no way of recording temperature, weather, or climate. Thankfully, scientists have been able to obtain proxy records (approximate records of climate) from the Earth itself. By examining tree rings, ice cores, coral reefs, and the sediment at the bottom of bodies of water scientists can find out a lot about what was happening on the Earth thousands of years ago. Holli riebeek related paleoclimatology to a crime scene and how detectives put clues and pieces of evidence together (Paleoclimatology: Introduction, 2005). Scientists take clues from what they discover about the past and piece together the Earth’s past climate.
Why would we want to know about the Earth’s climate thousands of years ago? Knowing about the past and how the Earth has experienced climate previously is instrumental in figuring out where our Earth is headed in the future. Climate change is happening, fast, and by looking into the past scientists are able to see if there are trends, or patterns that we may be falling into. It can also help us estimate how much of human activity is effecting climate change, and how much could be just natural.

To read all of Holli Riebeek’s Paleoclimatology: Introduction click here!

Wednesday, February 26, 2014

Ray Bradley

After reading Ray Bradley’s transcription of a lecture given in 2009, these are two questions that I would ask him if I could, and why.
Because of the ways in which data is collected (ice cores, tree rings, reefs, lakes) are there areas of the world that do not have that kind of data (data that looks back thousands of years)? For example, in deserts, how is/could data be collected there?
  • I would hope that he would explain where in the world there are deficits of data and why. I also would expect him to say whether or not there is a way to collect data in those places, and why they have yet to do so. I want to know if this is something that scientists are concern about or think about, or if they think that they have all this data collection under control. Do they think that they’re getting information from enough of a variety of places? I think a scientist’s perspective on this is the most important, because it is their work.
Scientists have all this information about the ways in which our climate is changing, and we know that there needs to be some switches away from coal as an energy source, but what can I do? What can someone who isn’t a political figure or millionaire do to help protect the Earth against global warming?

  • I can’t say that I have any idea what he would say in response to this. After learning about what he is describing, I want to know how I can productively use this information. I want to know his answer because knowing all this is well and good, but if I can’t do anything by myself, I want to at least know how to help get this information out there.

Diatom Algae Populations

In this video we see scientists collect diatoms from lakes and examining the sediments at the bottom of the lake. Because of the nature of the diatoms they examine, they are able to see which diatoms were present in the past. Using diatoms as a tool, they are able to see how climate change and global warming affect lake ecosystems, including the surrounding plant life.
To see the video click here!

"How Do We Know?"

This video features different scientists describing the different ways we can reconstruct climate history. Some of the things they talk about are coral reef cores, sediment layers in a lake basin, ice cores, and deep sea sediments. With all these kinds of data collection, scientists can reconstruct a decent amount the Earth’s past climates.
To watch the video click here!

Ice Core Records

In this video, Richard Alley shows us how examining ice can show us about what happened on this Earth thousands of years ago. Scientists can analyze the gases, especially carbon dioxide, present in the ice to figure how much carbon dioxide was in the atmosphere at that time. Over time they’ve been able to see how the levels of carbon dioxide correspond very closely with the temperatures of that time. Their relationship is not something to be ignored.
To watch the video click here!

Tuesday, February 25, 2014

Jeff Tollefson

Jeff Tollefson is a reporter and writer for Nature, a weekly science journal. He has previously worked for Congressional Quarterly as well as the Billings Gazette. He has won many accolades as a science reporter. As far as reliability goes, I would say that I trust a scientific journal but am skeptical because he is not a scientist. After reading one of his articles, "The Case of the Missing Heat" I have to say that I'm not persuaded to thinking that we are not experiencing global warming. Although he claims that skeptics as well as scientists are convinced that they previously overestimated the severity of the effects of greenhouse gases, I think he and those supposed people are focusing too too short term. While he appears to make valid points, it is my opinion that he is further illustrates the "skeptic" view of global warming that is shown on the figure below.


Figure 1: Skeptics and Realists Views of Global Warming
Image Source: http://www.jimharris.com/wp-content/uploads/2012/02/skepticsvrealists_500.gif

Skeptical Science Website

The website SkepticalScience.com gives in depth explanations for anything related to global warming and climate change. Despite the fact that the site is set up with bright colors and ads down the right side, I think the website is fairly reliable. While exploring the site I went to the "about" section and read that while one man runs the site, he uses peer reviewed articles and other scientific literature when creating his posts. Although I wouldn't use this as a main source in any research, I wouldn't discount it when looking for some information. It's especially handy that you can select the complexity of explanations. For those of us who do not have science minds, the simplified explanations are much more appealing.