Showing posts with label Research Portfolio. Show all posts
Showing posts with label Research Portfolio. Show all posts
Thursday, May 8, 2014
Presidents' Climate Commitment
This week I found out that my school, Westfield State University, was a part of American College and University Presidents' Climate Commitment! This means that the school has to follow and take certain actions in the fight against climate change. In the Commitment Text (here) it says that signatories must "Initiate the development of a comprehensive plan to achieve climate neutrality as soon as possible, Initiate two or more of the following [7] tangible actions to reduce greenhouse gases while the more comprehensive plan is being developed (listed on the website), [and] Make the action plan, inventory, and periodic progress reports publicly available by submitting them to the ACUPCC Reporting System for posting and dissemination." The first two have more specific guidelines on the website. I thought it was really cool that our campus is a part of this and am proud to a part of this idea and movement!
Political Cartoon

Image Source: https://www.youtube.com/watch?v=9h7P8gWpolQ
This cartoon illustrates how although the signs of global warming are there (besides the fact that we know climate change is real!) there are still people denying that it's happening. Especially after the cold winter we had this year and the polar vortex, there are a lot of people who are trying to say that global warming is no more and the Earth's temperature is declining!
How Does Climate Change Affect Animals?
This video gives a few examples of animals and bugs that are being affected by climate change. It's projected that 1 in 3 species will die out as a result of climate change! I was surprised that one insect benefitted from climate change, the bark beetle. But as the video explains, this means that they are growing and destroying more trees which in turn destroys the habitats of other species. It's a short video but raises concerns about animals from different areas of the world! Climate change affects everyone!
Deforestation Causes

Figure 1: Causes of Deforestation from 2000 to 2005
Figure Source:https://blogger.googleusercontent.com/img/b/R29vZ2xl/AVvXsEhdbnjzS2xNCYK3WLs323-rECfmdogd6WNbOIaAi7-P-JVA6laQEc0vglpNqlekBbN_R_5oRTxXm249jj8i6hwnjkFYBffU97CYoaSyzhnyQf_ewwwVSPuVa7lVXZ5l4QfLMVXuoCguKPZ4/s400/Causes_of_deforestation_chart.jpg
A few times in my Climate Change course my professor mentioned that much of the deforestation being done was for the purpose of cattle farming and soy production for cheap beef. It's amazing to see how much of deforestation is really being causes by the need for cattle ranches. All of the other causes combined are barely over half of that single cause.
Comparison of Resources
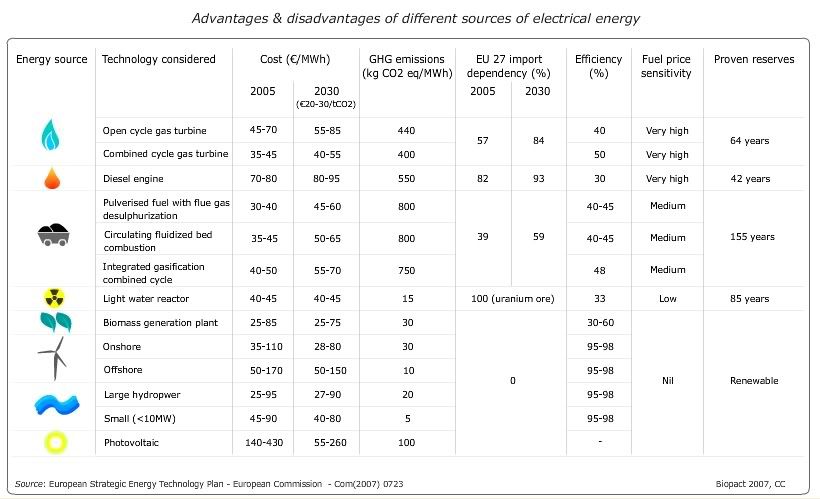
Image Source: http://i234.photobucket.com/albums/ee274/biopact3/biopact_EU_energy-technologies.jpg?t=1195856315
I like this chart because it breaks down different renewable and nonrenewable resources and shows costs, import dependency, efficiency, and reserves: all important aspects to consider! It's interesting to see such low numbers for proven resources, but also scary because some of those are within my lifetime! It's also interesting to see the efficiencies. I wonder how they determine that efficiency and if those comparisons relate to the size, costs, or what? I don't know, it's just a thought so if you have any ideas let me know!
Worldmapper
Worldmapper is a cool website that has almost 700 maps! Each map is shaped according to the data that it is about, so each map looks distorted according to the subject. You can find maps on population, food, income, births/deaths, education, resources, violence, etc. It’s organized by category for easy browsing! An example below shows use of coal power rates across the globe. You can see how this world map does not quite resemble the normal world map, rather it's resized to fit the data!

Image 1: Coal Power
Image Source: http://www.worldmapper.org/images/largepng/113.png
This map shows the use of coal for power across the globe. You can see how the U.S. and China are leaders in this, while most of South America does not use coal or uses very little.

Image Source: http://www.worldmapper.org/images/largepng/113.png
This map shows the use of coal for power across the globe. You can see how the U.S. and China are leaders in this, while most of South America does not use coal or uses very little.
Crossfire Debate
Crossfire hosted a discussion between Bill Nye, a well known scientist, and Nick Loris an environmentalist on the urgency and seriousness of climate change. Most of it was Nye attempting to get out there that climate change is a serious and prominent issue, while Loris was arguing against mitigation and costs. Loris also said that he does not think that we are on our way to "catastrophic warming" and mentioned that human influence are only a small part (FALSE) of the warming. The debate is heating and everyone is talking over each other, but if you have time to watch the video (about 9 minus) or read the transcript, it's an interesting perspective (here). The hosts also show an interesting split, just like Nye and Loris. Another note, I liked seeing that at the bottom of the screen it said "join the discussion" instead of debate (yay baby steps!!) because really this is a discussion now and should not be a debate about whether or not climate change is happening: it is!
Greenhouse Gas Game!
Another fun game to get kids thinking about global warming. This game simulates the greenhouse effect using a small ball to try and knock away greenhouse gases, while also having to try and break sun back through the atmosphere so it does not get trapped. It's fun and challenging (I couldn't get past level 1 without failing!) and a good way to get the conversation about global warming and climate change going with your kids or teens!
Try the game here and see if you can get all the way to level 5!
Try the game here and see if you can get all the way to level 5!
Without Adaption Comes Extinction
TIME magazine's article from 2008 still holds a lot of truth about animals being impacted by climate change. The article discusses how while humans are being intensely affected, we can more easily adapt. Animals, though, cannot so easily adapt quickly. If an animals habitat is changed as rapidly as we're seeing they do not have time to adapt themselves and may not be able to migrate, instead they become extinct. Now when protecting animal's habitats, conservationists need to be sure that their habitat stays in the condition that is best for those animals.
To read to full article here!
To read to full article here!
Sea Level Rise

Figure Source: http://www.nasa.gov/images/content/121630main_slr_thermal.jpg
This graph shows how in just the past 50 years sea level has risen over 20mm. While that doesn't seem like too much, it appears to be increasing more rapidly and will continue to as the Earth's temperature continues to rise. With rising sea level, coastal towns and cities are at risk for flooding, which can have detrimental damage and cause massive evacuations of cities. Many cities already have plans (look back at my post about Massachusetts's Plan) for rapid sea level rise that include adaptations and mitigation strategies. If you live near the coast, check out if your state has a plan!
We need change fast!

I think this cartoon really illustrates how climate change is a powerful force that has crept up on us (while we debate if it's really happening or not, which it is!) and how slow we are to be doing something about it. Now that we have decided (at the government level at least) that climate change is happening, we have to do something about it. The IPCC released new reports, states and countries are creating plans, but some of those plans are very vague and/or long term. I know that it can take time for projects to be put into action and then new structures build and kicked into gear. But that's why we need to start making decisions on what kind of renewable energy structure we're going to build now! Otherwise we're going to be swept way by climate change.
Climate Change Survey Poster
For my Climate Change course, we surveyed students and faculty about climate change. In groups we then analyzed the data collected and presented at the UMass Undergraduate Research Conference in April. My group presented on the data that was collected around the opinions of the people surveyed. We created a poster to present this data, in relation to similar data that Yale collected a few years ago when they created the Six Americas or categories of concern and thinking around climate change.
Here is a link to our poster!
Here is a link to our poster!
Weather Fatalities

Figure Source: http://www.statschat.org.nz/wp-content/uploads/2012/10/weatherfatalities1.jpg
This figure shows weather related fatalities over the past century. As you can see there has been start increases over the past few decades relating to heat and hurricane related natural disasters. With climate change comes an increase in extreme weather. Global warming and climate change are on the rise, and it is likely that we will experience more extreme natural disasters such as flooding, hurricanes, tornadoes, and extreme heat. With these disasters comes increased risk of death. I think that over the next few decades (and probably longer) we will see spikes in deaths, such as is illustrated on this graph.
Denmark hopes to abandon coal, oil, and gas by 2050!
Denmark is currently using renewable sources for about 23% of the countries energy consumption. Ambitiously, it hopes to be 100% reliant on renewable energy by 2050. The country has excellent conditions for wind farms, and is in the process of setting up a 600-megawatt wind farm between themselves, Germany, and Sweden. They are confident that they will be able to reach their goal, saying the only difficulty will be in regards to transportation, but are currently working on means of electric storage from wind turbines. To read more about Denmark's goal's and their process towards that goal, click here!
Peak Oil
Here is a link to a blog post by Matthew Wild. He describes what "peak oil" is and the original theory around it. Peak oil is a point in time where we have reached out maximum output of oil, and all the time thereafter the production of oil declines. This is a very relevant and serious issue right now because we are at that point. Very soon we will have to be making decisions about other, more sustainable energy sources because we will have no more gas and oil. It sounds crazy, and maybe not in our lifetime, but our children could see the end of oil and gas. A scary but real thought. It's time to start focusing on renewable sources and making those a priority, instead of trying to find ways to make more oil appear out of the Earth.
Tuesday, May 6, 2014
Coffee Production Hit Hard
Drink coffee? Climate change is already affecting that, and with changes in air temperature and pest control, coffee production is dropping fast. Coffee beans grow in a certain climate, as do most products, and because of the changing temperatures and climate around the globe the production of coffee is decreasing. Bummed that soon coffee may become scarce? I would worry more if you were a coffee bean farmer. It's projected that hundreds of thousands of people who are part of coffee bean farms and families will soon be negatively affected. Many already are. Check out a video to learn more about it here!
Gay Head Lighthouse

One of the lighthouses on Martha's Vineyard is set to be moved this fall. Because of erosion, the shore is growing closer and close to the lighthouse, 46 feet to be exact. They need around 40 feet in diameter around the lighthouse in order to safety move it, so that it can still be used, which means they have to act now or within less than 2 years it there would not be enough land. This lighthouse it vital to mariners which is why there is urgency to move it! It has been standing since 1854, and will hopefully continue to stand, just in a different place!
To read about the project and learn more about the lighthouse's history check out it's website here!
Mass Climate Change Adaptation Report: Executive Summary
Instead of reading the entire report (I'm a college student, I don't have all day!) I read the executive summary report that was created. I was astounded to find out that our average air temperature has already increased by almost 2 degrees since 1970, and that the average water surface temperature has increased over 2 degrees. I was also completely blown away by the numbers related to Boston and what even just one incident could cost. It's scary to think that by 2050 so much of the coast could be in danger, or already flooded. The report talks about using mitigation strategies as a local level, although they want to be thinking about sustainability throughout the state. Their plans include assessment and updates as well as reusing resources and using friendly design.
To look more into the executive summary click here!
If you're ambitious and would like to read the entire report, click here!
To look more into the executive summary click here!
If you're ambitious and would like to read the entire report, click here!
Federal Report on Climate Change
A report that scientists and government officials have been collaborating on since 2012 was rereleased having been further reviewed since January. The report discusses the impacts that the United States will feel as a result of climate change regionally and at the state level. This report was written in simple language so that it was more accessible to people without scientific background. While I do not have the report, I have linked here an article from the Boston Globe that discussed more about this report and what people are saying about it.
Carbon Tax
This video gives a short explanation about how a carbon tax works. Specifically this video talks about the carbon tax that is being implemented in Australia. The animations and language make it easy to understand and it's short, so you don't have to sit around all day to learn about carbon taxes, just two minutes!
Subscribe to:
Posts (Atom)